
PAULA: Protein Analysis Using a Least-squares Approach
Published:
Last year, I took a physical chemistry class which had to do with the behaviour and analysis of biomolecules (mainly proteins and nucleic acids). It was fun to step outside of my comfort zone and being in a chemistry lab again, and I had a great deal of fun learning about bio-stuff again. The course worked by alternating theory classes (where we learned the formal aspects of the techniques we would later apply) and lab sessions. We were given a small sample of the problem molecule which we wanted to characterise over a period of two-or-so months, which in this case was hen egg-white lysozyme, a cheap and common protein. One goal was to pass polarised ultraviolet light through a sample of this protein, and measure how well the protein is able to twist the plane of the incident light rays. This technique is called far-ultraviolet circular dychroism, and it turns out that learning about the way a protein interacts with these particular wavelengths in this very particular sense yields a great deal of information about its structure!
(If you don’t know what polarisation is, check the relevant Wikipedia article: it’s a very interesting phenomenon which explains a lot of the things we see in everyday life; the bottom picture illustrates three different ways a light wave can be polarised, but there are more). 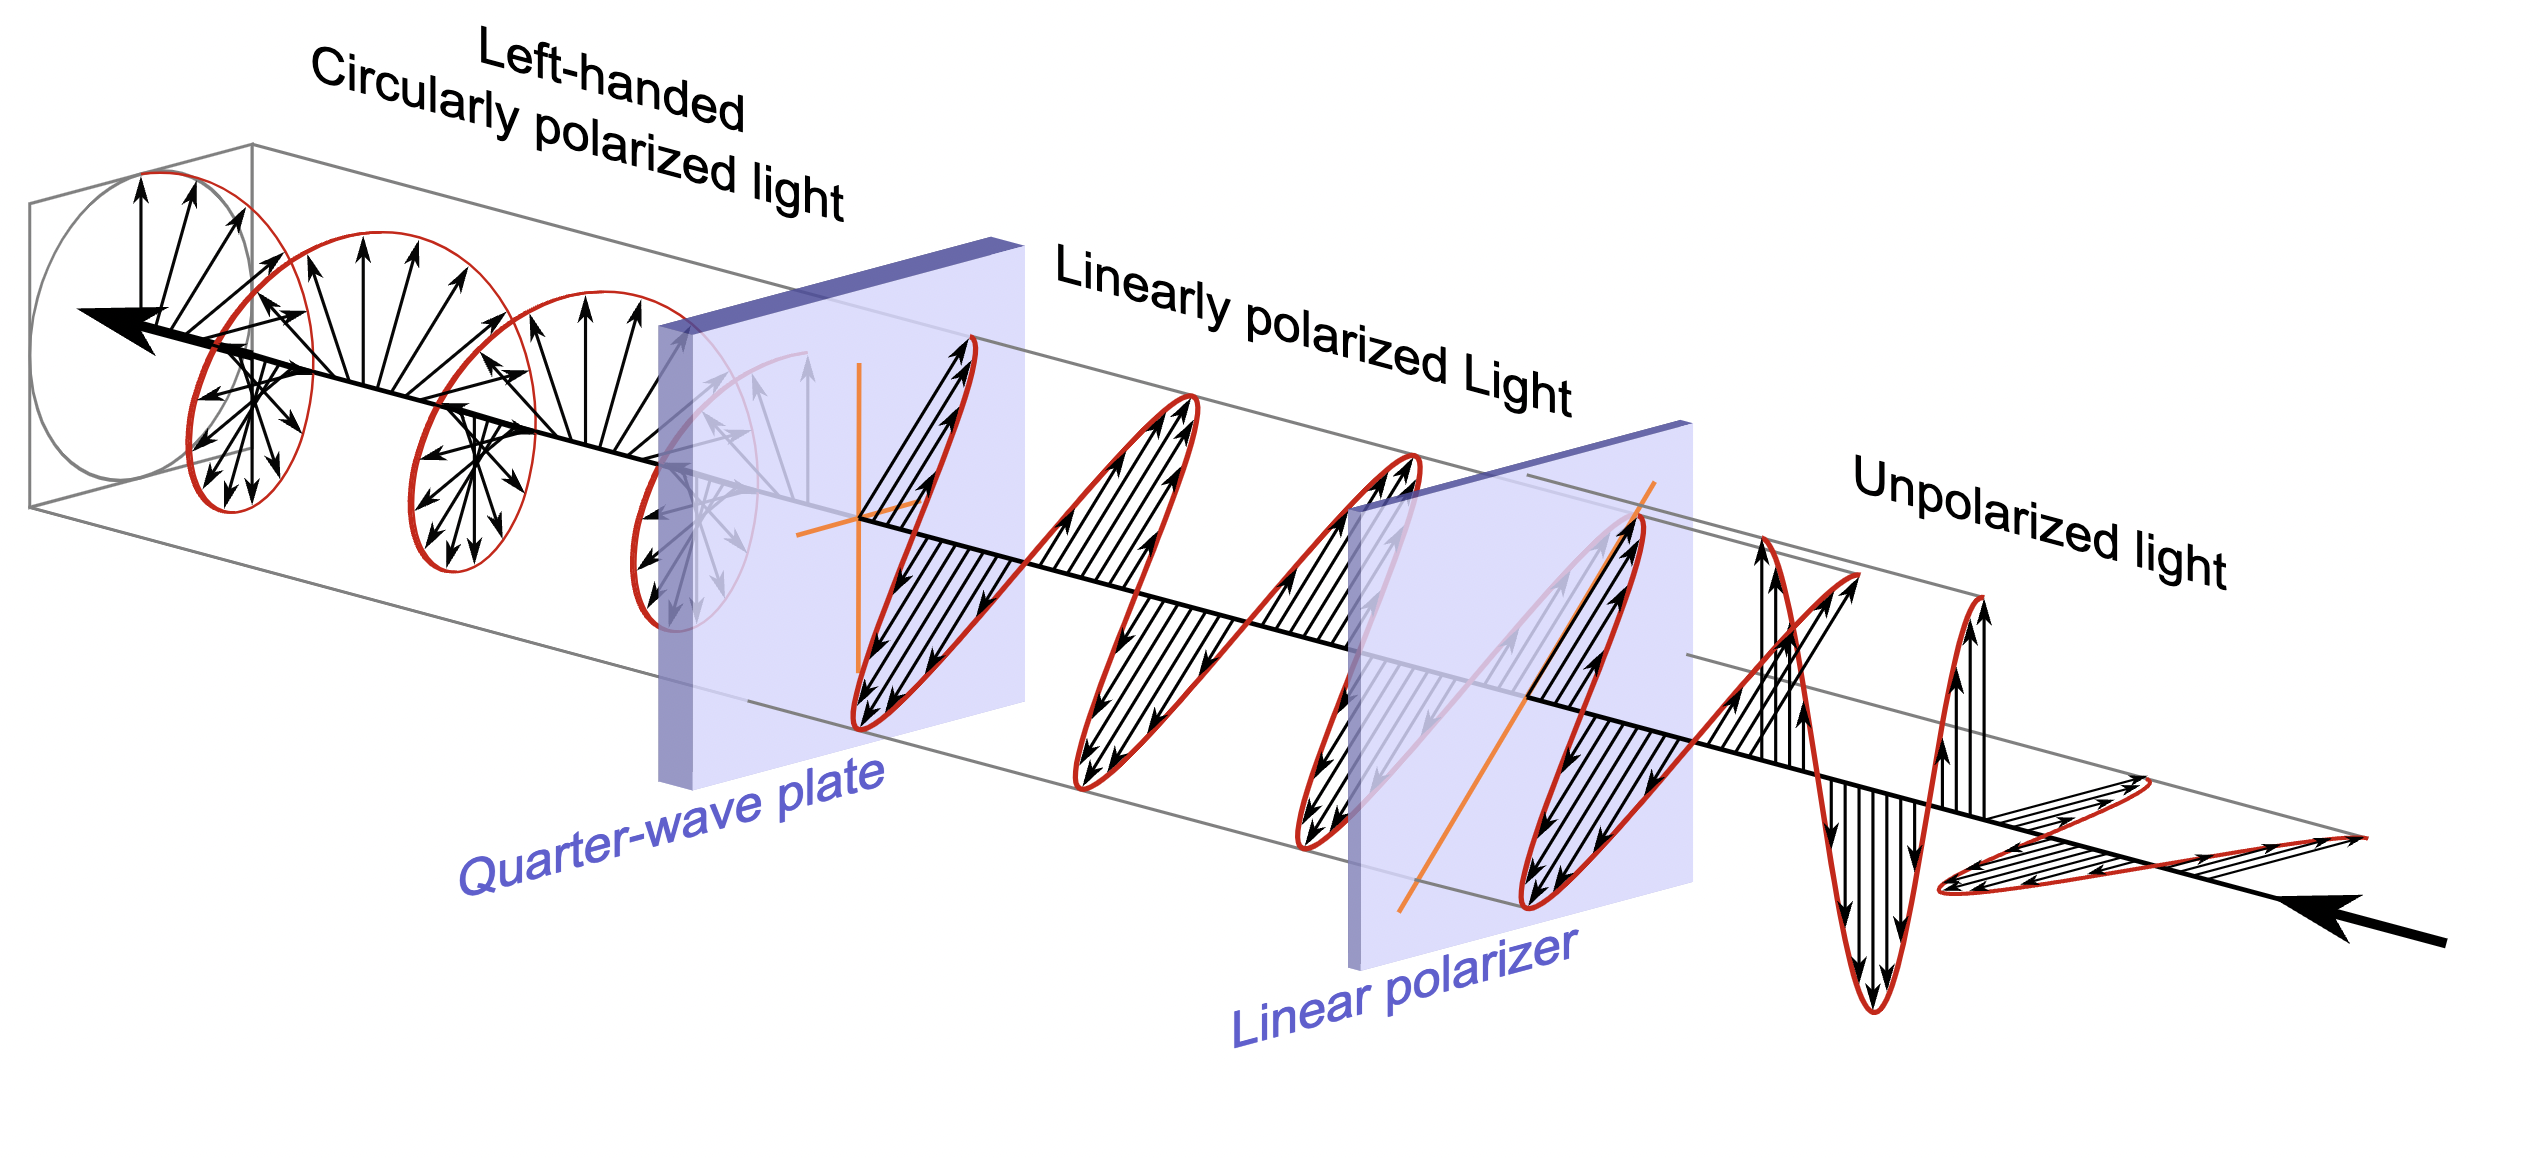
Since proteins are very complex molecules they can be studied at different levels. They are somewhat like chains, and therefore one can study the links that make them (that is, the sequence of aminoacids that define a protein). This is the primary structure of a protein. Furthermore, these links organise themselves spatially in all sorts of patterns, like little sheets, helices, coils and so on. This is called the secondary structure of a protein. There are two more levels of structure, but this will suffice for now, because circular dychroism yields information about the secondary structure of a protein! By finding out how light’s polarisation changes after passing through a sample of the protein, we can estimate the percentage of each of these different motifs.
The thing is, we had to use a pre-made webpage that worked very badly with our collected data. The results were utter nonsense and completelly useless. Although I will not mention the name of the page we were recommended to use, I will say that it 1) used a computationally generated dataset instead of empirically obtained data, and 2) required you to addapt to the particular units this research group used in their work. Although unit changes are very easy to deal with, it turns out that in circular dychroism the units are gruesome. There are many options and some unit changes require the use of information which may very well be out of reach if you’re dealing with a new protein. This made the simple process of uploading a text file and collecting your results a lot more tiresome than it needed to be.
At the time, I thought of a way to analyse the data that seemed better. I thought I could use an approach similar to theirs, but base it on empirical data (which I was able to obtain from an 80’s paper, since polarisation hasn’t changed much in the last 13.787 ± 0.020 billion years or so). I also thought about making it unit-independent. This is possible because a unit conversion is just a one dimensional change of basis: the graph obtained in the lab will not change shape, only size. It will be escalated, but will retain the same information, and is therefore susceptible to being analysed independently of the units employed. I promised my professor I would put together a page for my classmates to use in exchange for an extra point in my final grade, and he agreed.
 (Spoiler: this is what PAULA looks like.)
Behold! PAULA (Protein Analysis Using a Least-squares Approach) is here. It uses advanced machine-learning algorithms (hah) and works, comparatively, like a charm. By uploading any protein’s circular dychroism spectrum, you can get a good estimation of the protein’s composition. (You can get some spectra here if you wish to try, or use the one I set as an example in the page itself). I used Shiny, with all the base code being written in R. More details on how PAULA works can be found here, if you’re interested.
Finally, a way to analyse all of those unknown protein secondary structures, right?
See you soon, and have a nice summer 😇